Research shows that there are two distinct systems involved in the stress response of humans and other animals. The response and activity of both systems can be measured via various biomarkers in saliva. The classic method of characterising a stress response is to measure cortisol levels, which rise due to a series of changes in the hypothalamic-piuitary-adrenal (HPA) axis. However, research has shown that this system can be relatively slow in responding to stress (a latency of some 10-15 minutes); whilst changes in the sIgA and alpha-amylase response, markers of the sympathetic nervous system (SNS) activity, are somewhat quicker1. It is also well known that chronic stress with elevated cortisol levels can lead to immune suppression and reduced sIgA values. With repeated measurements within a day the diurnal pattern of all biomarkers can be established quickly and conveniently on the SOMA LFD platform.
The Diurnal Profile
In corporate and health & wellness settings it is more common to look at the diurnal profile of cortisol, typically with 5 samples taken throughout the day.
Typical diurnal profile sample times:
- Awakening
- Awakening +30 minutes
- Midday
- Around 5 p.m.
- Bedtime
What’s “Normal”??
“Normal” values are challenging at the best of times. Even with lab assays, there are a variety of different kits that can be used and they all give different values for the same sample. Added to that, using the same assay kits in different labs will still give variability2.
This is why we provide data using only SOMA kits to help you put your results into context. Independent research has shown SOMA Cortisol tests give similar values to Salimetrics laboratory ELISA kits3.
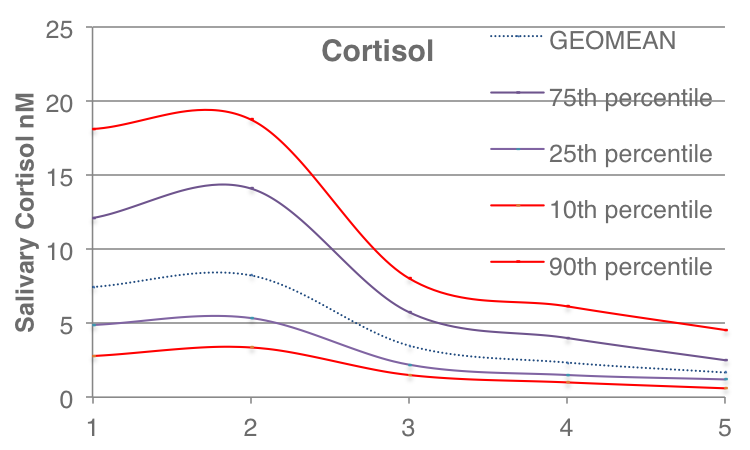
Cortisol Profiles from 267 individuals (170 male, 97 female) using the SOMA cortisol assay. (Time Points are (1) Awakening; (2) +30 minutes; (3) ~12:00; 4 ~17:00; (5) Bed-time).
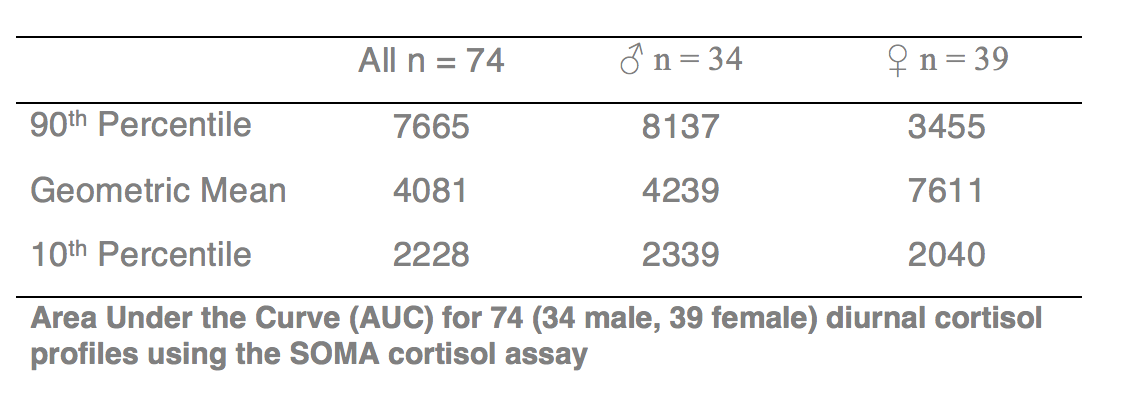
Area Under the Curve
The shape and character of the diurnal profile of cortisol can give useful insight. In well functioning individuals there is typically a sharp peak between sample 1 & 2, with minimal values in the evening. The area under the curve (AUC) can be useful to examine the overall stress output. A flat profile implies chronic stress. To measure AUC you need the exact time of day that the samples were taken and the cortisol values using SOMA cortisol assay
Alpha-Amylase
Cortisol is a great biomarker for monitoring chronic stress or catabolic activity in physical contexts, but if measuring acute stress is your thing, then try the protein markers of alpha-amylase or IgA to investigate rapid stress responses. One of the advantages of these tests is although they have a small diurnal pattern; it is not nearly as pronounced as the cortisol diurnal rhythm. This can make these protein markers a good alternative for stress monitoring where time of day (or more appropriately, time since awakening) cannot be so rigidly controlled.
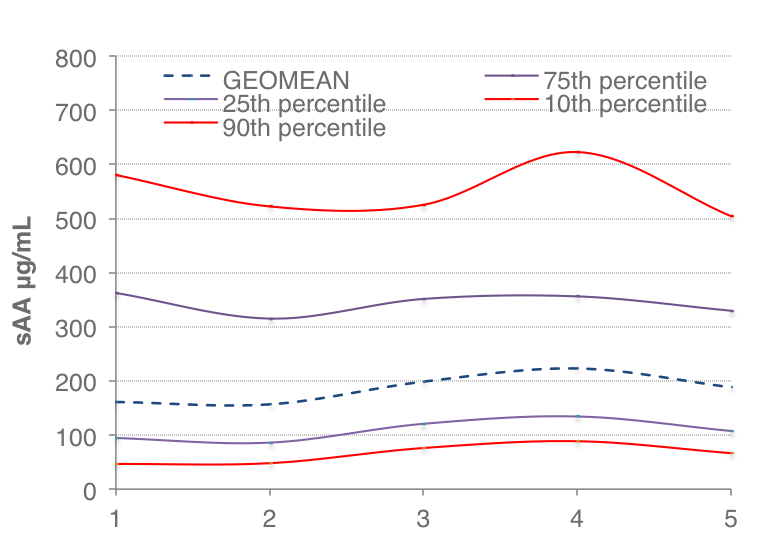
Salivary Alpha-Amylase (sAA) Profiles from 89 individuals (58 male, 31 female) using the SOMA sAA assay. (Time Points are (1) Awakening; (2) +30 minutes; (3) ~12:00; 4 ~17:00; (5) Bed-time).
REFERENCES:
- 1. Nomura S (2012) Salivary Hormones, Immunes and Other Secretory Substances as Possible Stress Biomarker, Biomarker, Prof. Tapan Khan (Ed.) p 247-270
- Miller R et al., (2013) Comparison of salivary cortisol as measured by different immunoassays and tandem mass spectrometry. Psychoneuroendocrinology, 38: 50-57
- Fisher R et al., (2015) The Validity and Reliability for a Salivary Cortisol Point of Care Test. J Athl Enhancement, 4:4